Note
Go to the end to download the full example code.
Image Expansion
This script illustrates several expansion methods for 2D images developed in ASPIRE package based on the basis functions of Fourier-Bessel (FB) and prolate spheroidal wave function (PSWF).
import os
import timeit

import matplotlib.pyplot as plt
import numpy as np

from aspire.basis import FBBasis2D, FFBBasis2D, FPSWFBasis2D, PSWFBasis2D
from aspire.utils import anorm

print("This script illustrates different image expansion methods in ASPIRE package.")
This script illustrates different image expansion methods in ASPIRE package.
Load Initial Images
# Load the images from NumPy array, 10 images of 70S Ribosome with size 129 x 129
file_path = os.path.join(
    os.path.dirname(os.getcwd()), "data", "example_data_np_array.npy"
)
# Here the images were saved in Fortran order. Transpose from (129,
# 129, 10) to (10, 129, 129) so that the stack axis is the slowest
# moving axis.
org_images = np.load(file_path).T

# Set the sizes of images (129, 129)
img_size = org_images.shape[-1]
/home/runner/work/ASPIRE-Python/ASPIRE-Python/gallery/tutorials/tutorials/image_expansion.py:31: UserWarning: Reading `.npy` or `.npz` file required additional header parsing as it was created on Python 2. Save the file again to speed up loading and avoid this warning.
  org_images = np.load(file_path).T
Expand Images with Normal Fourier-Bessel Basis Method
# Specify the normal FB basis method for expanding the 2D image
# Note, we'll set the Basis dtype to be the same as the `org_images` data,
#  as good practice.
fb_basis = FBBasis2D((img_size, img_size), dtype=org_images.dtype)

# Get the expansion coefficients based on FB basis
print("Start normal FB expansion of original images.")
tstart = timeit.default_timer()
fb_coefs = fb_basis.evaluate_t(org_images)
tstop = timeit.default_timer()
dtime = tstop - tstart
print(f"Finish normal FB expansion of original images in {dtime:.4f} seconds.")

# Reconstruct images from the expansion coefficients based on FB basis
fb_images = fb_basis.evaluate(fb_coefs).asnumpy()
print("Finish reconstruction of images from normal FB expansion coefficients.")

# Calculate the mean value of maximum differences between the FB estimated images and the original images
fb_meanmax = np.mean(np.max(abs(fb_images - org_images), axis=(1, 2)))
print(
    f"Mean value of maximum differences between FB estimated images and original images: {fb_meanmax}"
)

# Calculate the normalized RMSE of the FB estimated images
fb_nrmse_ims = anorm(fb_images - org_images) / anorm(org_images)
print(f"FB estimated images normalized RMSE: {fb_nrmse_ims}")

# plot the first images using the normal FB method
plt.subplot(1, 3, 1)
plt.imshow(np.real(org_images[0]), cmap="gray")
plt.title("Original")
plt.subplot(1, 3, 2)
plt.imshow(np.real(fb_images[0]), cmap="gray")
plt.title("FB Image")
plt.subplot(1, 3, 3)
plt.imshow(np.real(org_images[0] - fb_images[0]), cmap="gray")
plt.title("Differences")
plt.tight_layout()

Start normal FB expansion of original images.
Finish normal FB expansion of original images in 0.6783 seconds.
Finish reconstruction of images from normal FB expansion coefficients.
Mean value of maximum differences between FB estimated images and original images: 0.003921813842345181
FB estimated images normalized RMSE: 0.021437787240246826
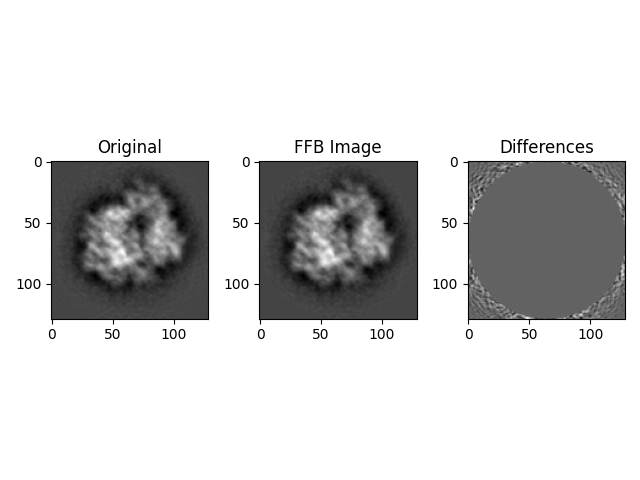
Expand Images with Fast FB Basis Method
# Specify the fast FB basis method for expanding the 2D images
# Note, we'll set the Basis dtype to be the same as the `org_image` data,
#  as good practice.
ffb_basis = FFBBasis2D((img_size, img_size), dtype=org_images.dtype)

# Get the expansion coefficients based on fast FB basis
print("start fast FB expansion of original images.")
tstart = timeit.default_timer()
ffb_coefs = ffb_basis.evaluate_t(org_images)
tstop = timeit.default_timer()
dtime = tstop - tstart
print(f"Finish fast FB expansion of original images in {dtime:.4f} seconds.")

# Reconstruct images from the expansion coefficients based on fast FB basis
ffb_images = ffb_basis.evaluate(ffb_coefs).asnumpy()
print("Finish reconstruction of images from fast FB expansion coefficients.")

# Calculate the mean value of maximum differences between the fast FB estimated images to the original images
diff = ffb_images - org_images
ffb_meanmax = np.mean(np.max(abs(diff), axis=(1, 2)))
print(
    f"Mean value of maximum differences between FFB estimated images and original images: {ffb_meanmax}"
)

# Calculate the normalized RMSE of the estimated images
ffb_nrmse_ims = anorm(diff) / anorm(org_images)
print(f"FFB Estimated images normalized RMSE: {ffb_nrmse_ims}")

# plot the first images using the fast FB method
plt.subplot(1, 3, 1)
plt.imshow(np.real(org_images[0]), cmap="gray")
plt.title("Original")
plt.subplot(1, 3, 2)
plt.imshow(np.real(ffb_images[0]), cmap="gray")
plt.title("FFB Image")
plt.subplot(1, 3, 3)
plt.imshow(np.real(org_images[0] - ffb_images[0]), cmap="gray")
plt.title("Differences")
plt.tight_layout()
start fast FB expansion of original images.
Finish fast FB expansion of original images in 0.0446 seconds.
Finish reconstruction of images from fast FB expansion coefficients.
Mean value of maximum differences between FFB estimated images and original images: 0.0037729398351294833
FFB Estimated images normalized RMSE: 0.02087983918178076
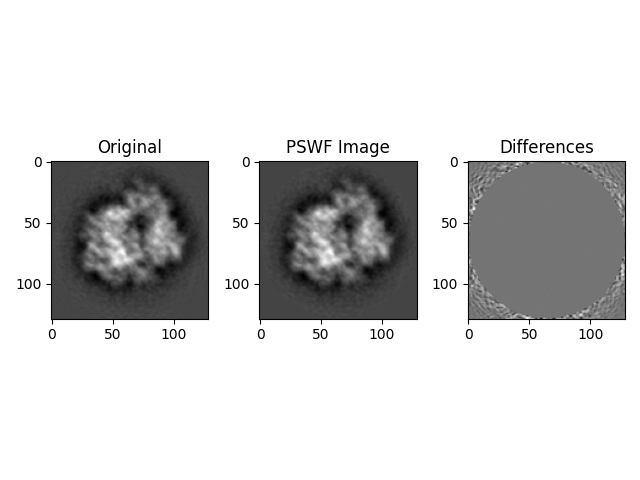
Expand Images with Prolate Spheroidal Wave Function
# Specify the direct PSWF basis method for expanding the 2D images
# Note, we'll set the Basis dtype to be the same as the `org_images` data,
#  as good practice.
pswf_basis = PSWFBasis2D((img_size, img_size), dtype=org_images.dtype)

# Get the expansion coefficients based on direct PSWF basis
print("Start direct PSWF expansion of original images.")
tstart = timeit.default_timer()
pswf_coefs = pswf_basis.evaluate_t(org_images)
tstop = timeit.default_timer()
dtime = tstop - tstart
print(f"Finish direct PSWF expansion of original images in {dtime:.4f} seconds.")

# Reconstruct images from the expansion coefficients based on direct PSWF basis
pswf_images = pswf_basis.evaluate(pswf_coefs).asnumpy()
print("Finish reconstruction of images from direct PSWF expansion coefficients.")

# Calculate the mean value of maximum differences between direct PSWF estimated images and original images
diff = pswf_images - org_images
pswf_meanmax = np.mean(np.max(abs(diff), axis=(1, 2)))
print(
    f"Mean value of maximum differences between PSWF estimated images and original images: {pswf_meanmax}"
)

# Calculate the normalized RMSE of the estimated images
pswf_nrmse_ims = anorm(diff) / anorm(org_images)
print(f"PSWF Estimated images normalized RMSE: {pswf_nrmse_ims}")

# plot the first images using the direct PSWF method
plt.subplot(1, 3, 1)
plt.imshow(np.real(org_images[0]), cmap="gray")
plt.title("Original")
plt.subplot(1, 3, 2)
plt.imshow(np.real(pswf_images[0]), cmap="gray")
plt.title("PSWF Image")
plt.subplot(1, 3, 3)
plt.imshow(np.real(org_images[0] - pswf_images[0]), cmap="gray")
plt.title("Differences")
plt.tight_layout()
Start direct PSWF expansion of original images.
Finish direct PSWF expansion of original images in 0.1032 seconds.
Finish reconstruction of images from direct PSWF expansion coefficients.
Mean value of maximum differences between PSWF estimated images and original images: 0.004102337541435031
PSWF Estimated images normalized RMSE: 0.02247998417283224
Expand Images with Fast PSFW
# Specify the fast FPSWF basis method for expanding the 2D images
# Note, we'll set the Basis dtype to be the same as the `org_images` data,
#  as good practice.
fpswf_basis = FPSWFBasis2D((img_size, img_size), dtype=org_images.dtype)

# Get the expansion coefficients based on fast PSWF basis
print("Start fast PSWF expansion of original images.")
tstart = timeit.default_timer()
fpswf_coefs = fpswf_basis.evaluate_t(org_images)
tstop = timeit.default_timer()
dtime = tstop - tstart
print(f"Finish fast PSWF expansion of original images in {dtime:.4f} seconds.")

# Reconstruct images from the expansion coefficients based on direct PSWF basis
fpswf_images = fpswf_basis.evaluate(fpswf_coefs).asnumpy()
print("Finish reconstruction of images from fast PSWF expansion coefficients.")

# Calculate mean value of maximum differences between the fast PSWF estimated images and the original images
diff = fpswf_images - org_images
fpswf_meanmax = np.mean(np.max(abs(diff), axis=(1, 2)))
print(
    f"Mean value of maximum differences between FPSWF estimated images and original images: {fpswf_meanmax}"
)

# Calculate the normalized RMSE of the estimated images
fpswf_nrmse_ims = anorm(diff) / anorm(org_images)
print(f"FPSWF Estimated images normalized RMSE: {fpswf_nrmse_ims}")

# plot the first images using the fast PSWF method
plt.subplot(1, 3, 1)
plt.imshow(np.real(org_images[0]), cmap="gray")
plt.title("Original")
plt.subplot(1, 3, 2)
plt.imshow(np.real(fpswf_images[0]), cmap="gray")
plt.title("FPSWF Image")
plt.subplot(1, 3, 3)
plt.imshow(np.real(org_images[0] - fpswf_images[0]), cmap="gray")
plt.title("Differences")
plt.tight_layout()

# Basic Check
assert fb_nrmse_ims < 0.025
assert ffb_nrmse_ims < 0.025
assert pswf_nrmse_ims < 0.025
assert fpswf_nrmse_ims < 0.025

Start fast PSWF expansion of original images.
Finish fast PSWF expansion of original images in 0.0295 seconds.
Finish reconstruction of images from fast PSWF expansion coefficients.
Mean value of maximum differences between FPSWF estimated images and original images: 0.004102337541435031
FPSWF Estimated images normalized RMSE: 0.022479984200630944
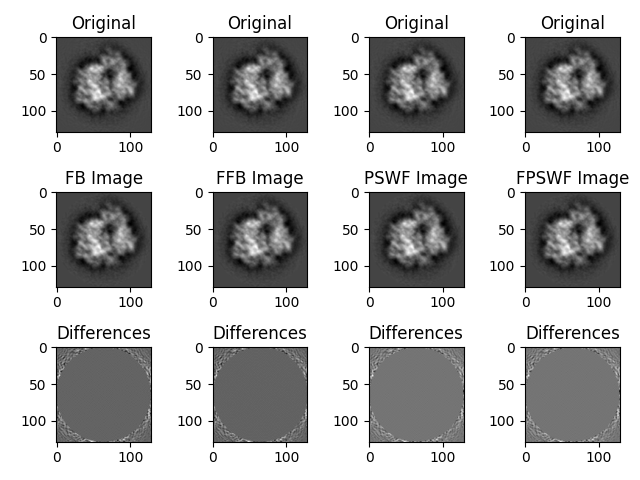
Side-by-side Comparison
Here we present the images side-by-side, column-wise, for comparison between the methods. All plotting commands are copied from the above sections and concatenated to render the comparison plot.
# plot the first images using the normal FB method
plt.subplot(3, 4, 1)
plt.imshow(np.real(org_images[0]), cmap="gray")
plt.title("Original")
plt.subplot(3, 4, 5)
plt.imshow(np.real(fb_images[0]), cmap="gray")
plt.title("FB Image")
plt.subplot(3, 4, 9)
plt.imshow(np.real(org_images[0] - fb_images[0]), cmap="gray")
plt.title("Differences")

# plot the first images using the fast FB method
plt.subplot(3, 4, 2)
plt.imshow(np.real(org_images[0]), cmap="gray")
plt.title("Original")
plt.subplot(3, 4, 6)
plt.imshow(np.real(ffb_images[0]), cmap="gray")
plt.title("FFB Image")
plt.subplot(3, 4, 10)
plt.imshow(np.real(org_images[0] - ffb_images[0]), cmap="gray")
plt.title("Differences")

# plot the first images using the direct PSWF method
plt.subplot(3, 4, 3)
plt.imshow(np.real(org_images[0]), cmap="gray")
plt.title("Original")
plt.subplot(3, 4, 7)
plt.imshow(np.real(pswf_images[0]), cmap="gray")
plt.title("PSWF Image")
plt.subplot(3, 4, 11)
plt.imshow(np.real(org_images[0] - pswf_images[0]), cmap="gray")
plt.title("Differences")

# plot the first images using the fast PSWF method
plt.subplot(3, 4, 4)
plt.imshow(np.real(org_images[0]), cmap="gray")
plt.title("Original")
plt.subplot(3, 4, 8)
plt.imshow(np.real(fpswf_images[0]), cmap="gray")
plt.title("FPSWF Image")
plt.subplot(3, 4, 12)
plt.imshow(np.real(org_images[0] - fpswf_images[0]), cmap="gray")
plt.title("Differences")
plt.tight_layout()

plt.show()
Total running time of the script: (0 minutes 48.502 seconds)